Bader電荷解析 †
Henkelman Groupが配布しているプログラムを利用してBader電荷の計算を行う。
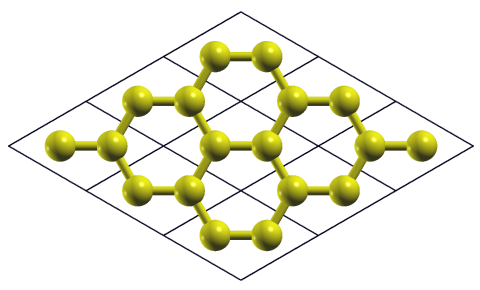
グラフェン 1x1 †

以下ではノルム保存擬ポテンシャルC_pbe6TMを用いる。
SCF計算 †
入力ファイル
0 0 0 0 0 0
8.0000  20.0000   1   2   2   : GMAX, GMAXP, NTYP, NATM, NATM2
191  0  : number of space group, type of bravis lattice
4.655538364 4.655538364 20.000  90.0   90.0  120.0  : a,b,c,alpha,beta,gamma
24    24       1       1      1     1     : knx,kny,knz, k-point shift
0   0   : NCORD, NINV,   : IWEI, IMDTYP, ITYP
0.6666666666      0.3333333333      0.0000000000  1   1  1
0.3333333333      0.6666666666      0.0000000000  1   1  1
6  0.1500  12.0107 1 1 0.d0  : TYPE 1IATOMN,ALFA,AMION,ILOC,IVAN
0 0 0 0 0 : ICOND 0-MD, 1-CONT.MD, 2-WAVE FN,, 3-WAVE FN CONT.,  iconstpw
    0   1   : IPRE, IPRI
    200   200     0    3600.00  0 : NMD1, NMD2, iter_last, CPUMAX,ifstop
    3   1  : Simple=1,Broyd2=3,Blugel=6,    1:charge, 2:potential mix.
    0   20  0.8 : starting mixing, kbxmix,alpha
   0.60  0.50  0.60  0.70  1.00    : DTIM1, DTIM2, DTIM3, DTIM4, dtim_last
  30.00     2     1    0.10D-08  1.d-06  : DTIO ,IMDALG, IEXPL, EDELTA
  -0.0010  0.10D+02    0           : WIDTH,FORCCR,ISTRESS
ggapbe          1                 : XCTYPE, nspin
   1.00     3                     : destm, n_stm
 101  : NBZTYP 0-SF, 1-BK, 2-SC, 3-BCC, 4-FCC, 5-DIA, 6-HEX
    0   0   0   : NKX, NKY, NKZ
    0   0   0   : NKX2,NKY2,NKZ2
    8           : NEG
        1       : NEXTST(MB)
        0       : 0; random numbers, 1; matrix diagon
        2      0      0      0(MB) : imsd, i_2lm, i_sd2another, wksz for phase
        0       : evaluation of eko difference.0 = no ,1 = yes
        0                       : npdosao
        0    0.0     : SM_N, DOPPING
計算結果
$ grep ETOT your_output_file_name|grep "[0-9]"
ETOT:   1     15.49339609  0.1549E+02  0.4996E-01
ETOT:   2      0.34620940  0.1515E+02  0.1209E-01
ETOT:   3     -5.83837125  0.6185E+01  0.1717E-01
ETOT:   4     -8.60080202  0.2762E+01  0.1845E-01
ETOT:   5    -10.11782100  0.1517E+01  0.2536E-01
ETOT:   6    -11.03537609  0.9176E+00  0.2397E-01
ETOT:   7    -11.40509046  0.3697E+00  0.2251E-01
ETOT:   8    -11.45549051  0.5040E-01  0.2050E-01
ETOT:   9    -11.48179862  0.2631E-01  0.1827E-01
ETOT:  10    -11.47035224  0.1145E-01  0.1958E-01
ETOT:  11    -11.53852896  0.6818E-01  0.1092E-01
ETOT:  12    -11.57400237  0.3547E-01  0.4760E-02
ETOT:  13    -11.58514681  0.1114E-01  0.1420E-02
ETOT:  14    -11.58579130  0.6445E-03  0.5748E-03
ETOT:  15    -11.58587175  0.8045E-04  0.1339E-03
ETOT:  16    -11.58587362  0.1875E-05  0.4189E-04
ETOT:  17    -11.58587413  0.5126E-06  0.1486E-04
ETOT:  18    -11.58587420  0.6892E-07  0.3361E-05
ETOT:  19    -11.58587421  0.4461E-08  0.1102E-05
ETOT:  20    -11.58587421  0.1802E-08  0.3413E-06
ETOT:  21    -11.58587421  0.2176E-09  0.1103E-06
ETOT:  22    -11.58587421  0.3718E-10  0.4886E-07
   ETOT(Q) + SM_energy =  -11.5858742100388        8.35680549919333
実空間の電荷密度 †
icond=9として再計算して実空間の電荷密度nfchgt_r.dataを作成する。
Gaussian cube fileの作成 †
/home/hamada/STATE/tools/ChargeUtil/chg2cubeを用いて電荷密度をGaussian cube形式に変換する。
$ chg2cube
Enter the name of the STATE input file> your_input_file_name
Enter the name of the charge density file> nfchgt_r.data
Enter the prefix for output file(s)> charge
reading nfchgt_r.data...done.
# of data in nfchgt_r.data : 1
data #1  : ispin : 1  : ilevel: 1
Creating charge.cube...done.
Program successfully ended
chg2cubeの実行後、対話的に
- STATEの入力ファイルの名前
- 電荷密度ファイルの名前(nfchgt_r.data)
- cubeファイルの名前(上ではcharge) を入力するとcharge.cubeが生成される。
Gaussian cube形式に関しては例えばここを参照。
Bader電荷の計算 †
上で得られたGaussian cube形式の電荷密度ファイルcharge.cubeを用いてBader電荷を計算する。
$ bader charge.cube

  GRID BASED BADER ANALYSIS  (Version 0.95a 02/26/16)

  OPEN ... charge.cube
  GAUSSIAN-STYLE INPUT FILE
  FFT-grid:    30 x  30 x 128
  CLOSE ... charge.cube
  RUN TIME:    0.03 SECONDS

  CALCULATING BADER CHARGE DISTRIBUTION
                 0  10  25  50  75  100
  PERCENT DONE:  **********************

  REFINING AUTOMATICALLY
  ITERATION: 1
  EDGE POINTS:         23177
  REASSIGNED POINTS:     969
  ITERATION: 2
  CHECKED POINTS:       9850
  REASSIGNED POINTS:       0

  RUN TIME:       0.15 SECONDS

  CALCULATING MINIMUM DISTANCES TO ATOMS
                 0  10  25  50  75  100
  PERCENT DONE:  **********************
  RUN TIME:    0.01 SECONDS

  WRITING BADER ATOMIC CHARGES TO ACF.dat
  WRITING BADER VOLUME CHARGES TO BCF.dat

  NUMBER OF BADER MAXIMA FOUND:              6
      SIGNIFICANT MAXIMA FOUND:              6
                 VACUUM CHARGE:         0.0205
           NUMBER OF ELECTRONS:        8.00003
オプション †
プログラムbaderのオプションはbader -hで確認できる:
$ bader -h

  GRID BASED BADER ANALYSIS  (Version 0.95a 02/26/16)

 Description of flags

    -c | -n  < bader | voronoi >
         Turn on [-c] or off [-n] the following calculations
            bader: Bader atoms in molecules (default)
            voronoi: population analysis based on distance

    -b < neargrid | ongrid | weight >
         Use the default near-grid bader partitioning, the
         original on-grid based algorithm, or the weight method
         of Yu and Trinkle

    -r < refine_edge_method >
         By default (-r -1) , only the points around reassigned
         points are checked during refinements. The old method,
         which checks every edge point during each refinement, can
         be enabled using the -r -2 switch:
            bader -r -2 CHGCAR

    -ref < reference_charge >
         Use a reference charge file to do the Bader partitioning.
         This is the recommended way to analyze vasp output files:
            bader CHGCAR -ref CHGCAR_total
         where CHGCAR_total is the sum of AECCAR0 and AECCAR2.

    -vac < off | auto | vacuum_density >
         Assign low density points to vacuum.
           auto: vacuum density cutoff is 1E-3 e/Ang^3 by default
           off: do not assign low density points to a vacuum volume
           vacuum_density: maximum density assigned to a vacuum volume

    -m < known | max >
         Determines how trajectories terminate
            known: stop when a point is surrounded by known points
            max: stop only when a charge density maximum is reached

    -p < all_atom | all_bader >
         Print calculated Bader volumes
            all_atom: all atomic volumes
            all_bader: all Bader volumes

    -p < sel_atom | sel_bader > <volume list or range>
         Print calculated Bader volumes
            sel_atom: atomic volume(s) around the selected atom(s)
            sel_bader: selected Bader volumes

    -p < sum_atom | sum_bader > <volume list or range>
         Print calculated Bader volumes
            sum_atom: sum of atomic volume(s) around the selected atom(s)
            sum_bader: sum of selected Bader volumes

    -p < atom_index | bader_index >
         Print index of atomic or Bader volumes
            atom_index: print atomic volume indicies
            bader_index: print Bader volume indicies

    -i < cube | chgcar >
         Input charge density file type.  If not specified, the
         program will try to determine the charge density file type
         automatically.

    -h
         Help.

    -v
         Verbose output.

    -cp
         Find critical points of the charge density
         Calculate eigenvalues and eigenvectors at those points
         Store results in file named CPF.dat
結果 †
Bader電荷の計算結果はACF.datに出力される:
$ cat ACF.dat
   #         X           Y           Z        CHARGE     MIN DIST    ATOMIC VOL
--------------------------------------------------------------------------------
   1   2.3277690   1.3439380   0.0000000   3.9020033   1.0751426  65.2790699
   2   0.0000000   2.6878760   0.0000000   4.0774900   1.2120244  69.3785643
--------------------------------------------------------------------------------
   VACUUM CHARGE:               0.0205
   VACUUM VOLUME:             240.7492
   NUMBER OF ELECTRONS:         8.0000
CHARGEに各原子の電荷が表示される。単位胞内の2つの炭素原子は等価なのに電荷に偏りが生じているのは、電荷密度のグリッドが粗いためと考えられる。
カットオフ依存性 †
エネルギーカットオフを増加させて(電荷密度のグリッドを細かくして)電荷分布の収束性を調べる。
| gmaxp | 20 | 30 | 40 | 50 | 60 | 70 | 80 | 90 | 100 |
| grid-X | 30 | 48 | 60 | 80 | 90 | 108 | 120 | 144 | 150 |
| grid-Y | 30 | 48 | 60 | 80 | 90 | 108 | 120 | 144 | 150 |
| grid-Y | 128 | 192 | 256 | 320 | 384 | 450 | 512 | 576 | 640 |
| 炭素原子1の電荷 | 3.902 | 3.934 | 3.945 | 3.956 | 3.960 | 3.965 | 3.967 | 3.971 | 3.972 |
| 炭素原子2の電荷 | 4.077 | 4.044 | 4.034 | 4.022 | 4.019 | 4.014 | 4.011 | 4.008 | 4.007 |
| 電荷の偏り | 0.175 | 0.110 | 0.088 | 0.066 | 0.059 | 0.049 | 0.044 | 0.037 | 0.035 |
| 電荷の偏り(%) | 4.375 | 2.750 | 2.200 | 1.650 | 1.475 | 1.225 | 1.100 | 0.925 | 0.875 |
カットオフの増加とともに電荷の偏りが減少し精度が向上していることが確認できる。
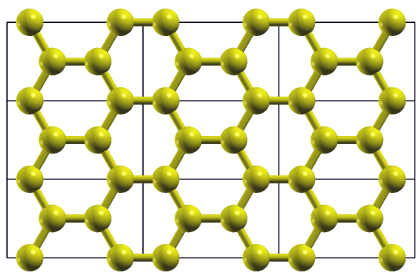
グラフェン 1x2/√3 †

入力ファイル
0 0 0 0 0 0
8.0000  20.0000   1   4   4   : GMAX, GMAXP, NTYP, NATM, NATM2
1  0  : number of space group, type of bravis lattice
8.063628983  4.655538364  20.000  90.0   90.0  90.0  : a,b,c,alpha,beta,gamma
12    24       1       1      1     1     : knx,kny,knz, k-point shift
1   0   : NCORD, NINV,   : IWEI, IMDTYP, ITYP
 1.3439381638      0.0000000000      0.0000000000  1   1  1
-1.3439381638      0.0000000000      0.0000000000  1   1  1
 2.6878763276      2.3277691820      0.0000000000  1   1  1
-2.6878763276      2.3277691820      0.0000000000  1   1  1
6  0.1500  12.0107 1 1 0.d0  : TYPE 1IATOMN,ALFA,AMION,ILOC,IVAN
0 0 0 0 0 : ICOND 0-MD, 1-CONT.MD, 2-WAVE FN,, 3-WAVE FN CONT.,  iconstpw
    0   1   : IPRE, IPRI
    200   200     0    3600.00  0 : NMD1, NMD2, iter_last, CPUMAX,ifstop
    3   1  : Simple=1,Broyd2=3,Blugel=6,    1:charge, 2:potential mix.
    0   20  0.8 : starting mixing, kbxmix,alpha
   0.60  0.50  0.60  0.70  1.00    : DTIM1, DTIM2, DTIM3, DTIM4, dtim_last
 100.00     2     1    0.10D-08  1.d-06  : DTIO ,IMDALG, IEXPL, EDELTA
  -0.0010  0.10D-02    0           : WIDTH,FORCCR,ISTRESS
ggapbe          1                 : XCTYPE, nspin
   1.00     3                     : destm, n_stm
 101  : NBZTYP 0-SF, 1-BK, 2-SC, 3-BCC, 4-FCC, 5-DIA, 6-HEX
    0   0   0   : NKX, NKY, NKZ
    0   0   0   : NKX2,NKY2,NKZ2
   24           : NEG
        1       : NEXTST(MB)
        0       : 0; random numbers, 1; matrix diagon
        2      0      0      0(MB) : imsd, i_2lm, i_sd2another, wksz for phase
        0       : evaluation of eko difference.0 = no ,1 = yes
        0                       : npdosao
        0    0.0     : SM_N, DOPPING
計算結果
$ grep ETOT nfout_1|grep "[0-9]"
ETOT:   1     26.21341351  0.2621E+02  0.3937E-01
ETOT:   2     -5.07267018  0.3129E+02  0.1212E-01
ETOT:   3    -15.33757551  0.1026E+02  0.1318E-01
ETOT:   4    -19.66071003  0.4323E+01  0.1333E-01
ETOT:   5    -22.00674384  0.2346E+01  0.1766E-01
ETOT:   6    -22.88457509  0.8778E+00  0.1587E-01
ETOT:   7    -22.92511351  0.4054E-01  0.1501E-01
ETOT:   8    -22.97540886  0.5030E-01  0.1372E-01
ETOT:   9    -22.95949325  0.1592E-01  0.1391E-01
ETOT:  10    -22.97376104  0.1427E-01  0.1353E-01
ETOT:  11    -23.04325978  0.6950E-01  0.9979E-02
ETOT:  12    -23.15572141  0.1125E+00  0.3768E-02
ETOT:  13    -23.16991809  0.1420E-01  0.1487E-02
ETOT:  14    -23.17160528  0.1687E-02  0.4518E-03
ETOT:  15    -23.17172043  0.1151E-03  0.1618E-03
ETOT:  16    -23.17173717  0.1673E-04  0.7242E-04
ETOT:  17    -23.17174331  0.6144E-05  0.2139E-04
ETOT:  18    -23.17174360  0.2898E-06  0.7831E-05
ETOT:  19    -23.17174357  0.3402E-07  0.3759E-05
ETOT:  20    -23.17174366  0.8909E-07  0.2707E-05
ETOT:  21    -23.17174376  0.1035E-06  0.1720E-05
ETOT:  22    -23.17174377  0.1106E-07  0.1275E-05
ETOT:  23    -23.17174379  0.1527E-07  0.1788E-05
ETOT:  24    -23.17174380  0.1140E-07  0.6630E-06
ETOT:  25    -23.17174380  0.3104E-08  0.3894E-06
ETOT:  26    -23.17174380  0.7199E-09  0.2579E-06
ETOT:  27    -23.17174380  0.6648E-10  0.5746E-07
   ETOT(Q) + SM_energy =  -23.1717438004519        16.7136110440348
カットオフ依存性 †
| gmaxp | 20 | 40 | 60 | 80 | 100 |
| grid-X | 54 | 108 | 160 | 216 | 270 |
| grid-Y | 30 | 60 | 90 | 120 | 150 |
| grid-Y | 128 | 256 | 384 | 512 | 640 |
| 炭素原子1の電荷 | 3.890 | 3.967 | 3.956 | 3.975 | 3.969 |
| 炭素原子2の電荷 | 4.088 | 4.011 | 4.023 | 4.023 | 4.009 |
| 炭素原子3の電荷 | 4.088 | 4.011 | 4.023 | 4.023 | 4.009 |
| 炭素原子4の電荷 | 3.890 | 3.967 | 3.956 | 3.975 | 3.969 |
| 電荷の偏り | 0.198 | 0.043 | 0.066 | 0.027 | 0.039 |
| 電荷の偏り(%) | 4.950 | 1.075 | 1.650 | 0.675 | 0.975 |
![[PukiWiki] [PukiWiki]](image/logo_state-senri3_80x80.png)