- バックアップ一覧
- 差分 を表示
- 現在との差分 を表示
- ソース を表示
- STATE_tutorial/Au111_H へ行く。
- 1 (2019-07-22 (月) 23:42:44)
- 2 (2019-07-23 (火) 00:44:35)
- 3 (2019-07-30 (火) 12:55:24)
- 4 (2019-07-30 (火) 19:18:16)
Hydrogen terminated Au(111) surface †
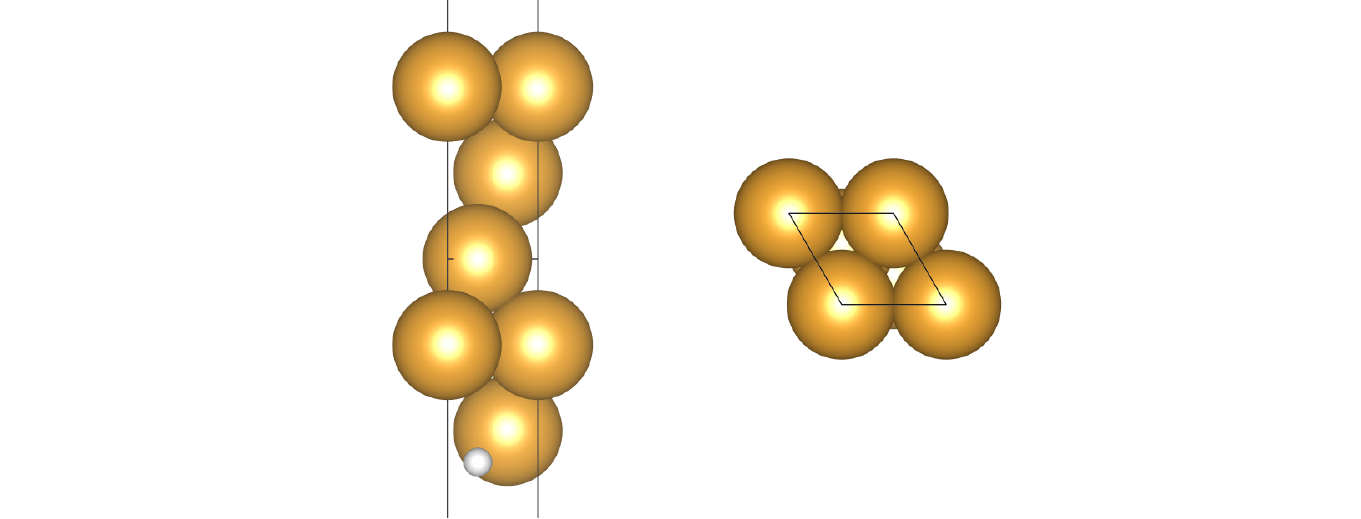
This tutorial explains how to analyze the electronic structure of a surface by using Au(111) slab with the bottom surface terminated by hydrogen.

SCF calculation †
To obtain the self-consistent charge density, electronic optimization is performed.
- Input file (nfinp_scf)
0 0 0 0 0 0 : I_CTROL (DUMMY) 6.00 20.00 2 6 6 : GMAX GMAXP NTYP NATM NATM2 1 0 : NUM_SPAC_GROUP BRAVIS_LATTICE_TYPE Cartesian 5.498778336527 0.000000000000 0.000000000000 -2.749389168264 4.762081729212 0.000000000000 0.000000000000 0.000000000000 85.304940510023 12 12 1 1 1 1 : NK1 NK2 NK3 MK1 MK2 MK3 1 0 : NCORD NINV : IWEI IMDTYP ITYP 0.000000000000 0.000000000000 8.979467422108 1 0 1 0.000000000000 3.174721152808 4.489733711054 1 0 1 0.000000000000 -3.174721152808 0.000000000000 1 0 1 0.000000000000 0.000000000000 -4.489733711054 1 0 1 0.000000000000 3.174721152808 -8.979467422108 1 0 1 0.000000026956 -3.174721183174 -10.610158124432 1 1 2 79.00 0.50 12.0107 1 1 0.0 : IATOMN ALFA AMION ILOC IVAN ZETA1 1.00 0.50 12.0107 1 1 0.0 : IATOMN ALFA AMION ILOC IVAN ZETA1 0 0 0 0 0 : ICOND INIPOS INIVEL ININOS INIACC 0 1 : IPRE IPRI 200 200 0 80000.00 0 : NMD1 NMD2 LAST_ITER CPUMAX IFSTOP 6 1 : WAY_MIX MIX_WHAT 0 20 0.60 : ITER_START KBXMIX MIX_ALPHA 0.20 0.30 0.20 0.20 0.20 : DTIM1 DTIM2 DTIM3 DTIM4 DTIM 200.00 2 1 1.0D-12 : DTIO IMDALG IEXPL EDELTA -0.0010 1.00D-03 0 : WIDTH FORCCR ISTRESS rev-vdW-DF2 1 : XCTYPE KSPIN 2.00 : DESTM 101 : NBZTYP 4 4 4 : DUMMY 4 4 4 : DUMMY 48 : KEG 1 : NEXTST 0 : DUMMY 2 : IMSD 0 : EVALUATE_EKO_DIFF 0 : NPDOSAO 0 0.000 : SM_N DOPING - Execution
In the command line or in the job script, execute> mpirun -np 24 < nfinp_scf > nfout_scf
PDOS (AOLDOS) calculation †
Then densities of state projected onto the atomic orbitals (PDOS/AOLDOS) are calculated by using the following input file:
- Input file (nfinp_aoldos)
 0     0     0     0     0     0            : I_CTROL (DUMMY)
 6.00 20.00  2     6     6                  : GMAX GMAXP NTYP NATM NATM2
 1     0                                    : NUM_SPAC_GROUP BRAVIS_LATTICE_TYPE
 Cartesian
      5.498778336527      0.000000000000      0.000000000000
     -2.749389168264      4.762081729212      0.000000000000
      0.000000000000      0.000000000000     85.304940510023
 12    12    1     1     1     1            : NK1 NK2 NK3 MK1 MK2 MK3
 1     0                                    : NCORD NINV : IWEI IMDTYP ITYP
      0.000000000000      0.000000000000      8.979467422108    1    0    1
      0.000000000000      3.174721152808      4.489733711054    1    0    1
      0.000000000000     -3.174721152808      0.000000000000    1    0    1
      0.000000000000      0.000000000000     -4.489733711054    1    0    1
      0.000000000000      3.174721152808     -8.979467422108    1    0    1
      0.000000026956     -3.174721183174    -10.610158124432    1    1    2
 79.00 0.50  12.0107     1     1       0.0  : IATOMN ALFA AMION ILOC IVAN ZETA1
  1.00 0.50  12.0107     1     1       0.0  : IATOMN ALFA AMION ILOC IVAN ZETA1
 14    0     0     0     0                  : ICOND INIPOS INIVEL ININOS INIACC
 0     1                                    : IPRE IPRI
 200   200   0     80000.00    0            : NMD1 NMD2 LAST_ITER CPUMAX IFSTOP
 6     1                                    : WAY_MIX MIX_WHAT
 0     20    0.60                           : ITER_START KBXMIX  MIX_ALPHA
 0.20  0.30  0.20  0.20  0.20               : DTIM1 DTIM2 DTIM3 DTIM4 DTIM
 200.00      2     1     1.0D-12            : DTIO IMDALG IEXPL EDELTA
-0.0010      1.00D-03    0                  : WIDTH FORCCR ISTRESS
rev-vdW-DF2  1                              : XCTYPE KSPIN
 2.00                                       : DESTM
   101                                      : NBZTYP
     4    4    4                            : DUMMY
     4    4    4                            : DUMMY
    48                                      : KEG
     1                                      : NEXTST
     0                                      : DUMMY
     2                                      : IMSD
     0                                      : EVALUATE_EKO_DIFF
     6                                      : NPDOSAO
     1
     2
     3
     4
     5
     6
-15.00 5.00  0.20  501                      : EPDOS(1) EPDOS(2) EPDOS(3) NPDOSE
 2.2   0.3                                  : RAD WIDTH FOR TYPE 1
 0.7   0.3                                  : RAD WIDTH FOR TYPE 2
 0.2   12                                   : DR NR
 0   0.000                              : SM_N DOPING
Here to calculate PDOS/AOLDOS by a postprocessing, ICOND is set to 14
14 0 0 0 0 : ICOND INIPOS INIVEL ININOS INIACC
NPDOSAO (Number of Atomic orbitals for PDOS) > 0
6 : NPDOSAO
followed by the atomic indices for which PDOS are calculated
     1
     2
     3
     4
     5
     6
Then minimum energy (EPDOS(1)), maximum energy (EPDOS(2)), width for Gaussian broadening (EPDOS(3)) (in eV), and energy mesh
-15.00 5.00 0.20 501 : EPDOS(1) EPDOS(2) EPDOS(3) NPDOSE
Cutoff radii (RAD) for the atomic orbitals and smearing width (WIDTH) in the Bohr radius
 2.2   0.3                                  : RAD WIDTH FOR TYPE 1
 0.7   0.3                                  : RAD WIDTH FOR TYPE 2
Width (DR) and number of grids (NR) for the radial integration
0.2 12 : DR NR
Note that EPSDOS(3) is used only when
&OTHERS
 GAUSSDOS
&END
is written in the input file for the calculation of density of states with the Gaussian smearing.
- Execution
> mpirun -np 24 < nfinp_aoldos > nfout_aoldos
- Analysis
PDOS/AOLDOS is printed by the keyword "AO_LDOS" in the output file as
AO_LDOS: atm spn  energy   s     px     py     pz    dzz dxx-yy    dxy    dyz    dzx  s+p+d     eg    t2g
AO_LDOS:   1 1 -15.00  0.000  0.000  0.000  0.000  0.000  0.000  0.000  0.000  0.000  0.000  0.000  0.000
AO_LDOS:   1 1 -14.96  0.000  0.000  0.000  0.000  0.000  0.000  0.000  0.000  0.000  0.000  0.000  0.000
AO_LDOS:   1 1 -14.92  0.000  0.000  0.000  0.000  0.000  0.000  0.000  0.000  0.000  0.000  0.000  0.000
...
PDOS/AOLDOS can be extracted by using the state2pdos.pl script asstate2pdos.pl nfout_aoldos
then the following messages are printedmake dos data file :: 0001 make dos data file :: 0002 make dos data file :: 0003 make dos data file :: 0004 make dos data file :: 0005 make dos data file :: 0006
meaning that the dos data are printed to files 0001, 0002, ... 0006. NOTE: with the latest version of the code, they will be pdos_0001.dat, pdos_0002.data, ... The data are given in the above files in the following order (column-wise):
Energy s px py pz dzz dxx-yy dxy dyz dzx s p d
Finally plot the data using for e.g., gnuplot or xmgrace.
Alternatively, you can perform SCF and AOLDOS calculation in the same run, simply setting NPDOSAO > 0 and other AOLDOS related parameters in the SCF calculations by using the following input file (nfinp_scf+aoldos)
 0     0     0     0     0     0            : I_CTROL (DUMMY)
 6.00 20.00  2     6     6                  : GMAX GMAXP NTYP NATM NATM2
 1     0                                    : NUM_SPAC_GROUP BRAVIS_LATTICE_TYPE
 Cartesian
      5.498778336527      0.000000000000      0.000000000000
     -2.749389168264      4.762081729212      0.000000000000
      0.000000000000      0.000000000000     85.304940510023
 12    12    1     1     1     1            : NK1 NK2 NK3 MK1 MK2 MK3
 1     0                                    : NCORD NINV : IWEI IMDTYP ITYP
      0.000000000000      0.000000000000      8.979467422108    1    0    1
      0.000000000000      3.174721152808      4.489733711054    1    0    1
      0.000000000000     -3.174721152808      0.000000000000    1    0    1
      0.000000000000      0.000000000000     -4.489733711054    1    0    1
      0.000000000000      3.174721152808     -8.979467422108    1    0    1
      0.000000026956     -3.174721183174    -10.610158124432    1    1    2
 79.00 0.50  12.0107     1     1       0.0  : IATOMN ALFA AMION ILOC IVAN ZETA1
  1.00 0.50  12.0107     1     1       0.0  : IATOMN ALFA AMION ILOC IVAN ZETA1
 0    0     0     0     0                  : ICOND INIPOS INIVEL ININOS INIACC
 0     1                                    : IPRE IPRI
 200   200   0     80000.00    0            : NMD1 NMD2 LAST_ITER CPUMAX IFSTOP
 6     1                                    : WAY_MIX MIX_WHAT
 0     20    0.60                           : ITER_START KBXMIX  MIX_ALPHA
 0.20  0.30  0.20  0.20  0.20               : DTIM1 DTIM2 DTIM3 DTIM4 DTIM
 200.00      2     1     1.0D-12            : DTIO IMDALG IEXPL EDELTA
-0.0010      1.00D-03    0                  : WIDTH FORCCR ISTRESS
rev-vdW-DF2  1                              : XCTYPE KSPIN
 2.00                                       : DESTM
   101                                      : NBZTYP
     4    4    4                            : DUMMY
     4    4    4                            : DUMMY
    48                                      : KEG
     1                                      : NEXTST
     0                                      : DUMMY
     2                                      : IMSD
     0                                      : EVALUATE_EKO_DIFF
     6                                      : NPDOSAO
     1
     2
     3
     4
     5
     6
-15.00 5.00  0.20  501                      : EPDOS(1) EPDOS(2) EPDOS(3) NPDOSE
 2.2   0.3                                  : RAD WIDTH FOR TYPE 1
 0.7   0.3                                  : RAD WIDTH FOR TYPE 2
 0.2   12                                   : DR NR
 0   0.000                              : SM_N DOPING
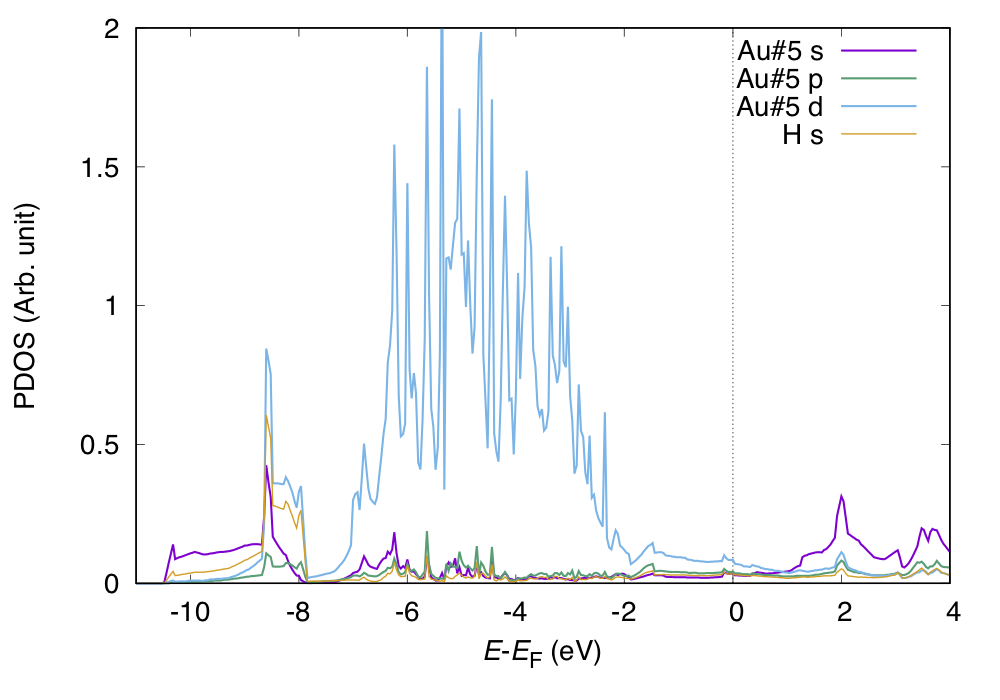
- Visualization Let us visualize PDOSs for the bottom Au and H atoms using gnuplot. Here is an example gnuplot script to generate an eps file (pdos.gp)
set terminal postscript eps color 'Helvetica' 20
set output 'pdos.eps'
xmin=-11.0
xmax=4.0
ymin=0.0
ymax=2.0
set xrange [xmin:xmax]
set yrange [ymin:ymax]
set yzeroaxis
set xlabel '{/Helvetica-Oblique E}-{/Helvetica-Oblique E}_F (eV)'
set ylabel 'PDOS (Arb. unit)'
plot 'pdos_0005.dat' using ($1):($11) title 'Au#5 s' with lines lw 3, \
     'pdos_0005.dat' using ($1):($12) title 'Au#5 p' with lines lw 3, \
     'pdos_0005.dat' using ($1):($13) title 'Au#5 d' with lines lw 3, \
     'pdos_0006.dat' using ($1):($2) title 'H s' with lines lw 2
Type
> gnuplot pdos.gp
to generate the eps file called "pdos.eps" as shown below

Band structure calculation †
The band structure calculation can be performed after the self-consistent charge and potential are obtained. Here's an example of the input file for the band structure calculation:
- Input file (nfinp_band)
 0     0     0     0     0     0            : I_CTROL (DUMMY)
 6.00 20.00  2     6     6                  : GMAX GMAXP NTYP NATM NATM2
 1     0                                    : NUM_SPAC_GROUP BRAVIS_LATTICE_TYPE
 Cartesian
      5.498778336527      0.000000000000      0.000000000000
     -2.749389168264      4.762081729212      0.000000000000
      0.000000000000      0.000000000000     85.304940510023
 12    12    1     1     1     1            : NK1 NK2 NK3 MK1 MK2 MK3
 1     0                                    : NCORD NINV : IWEI IMDTYP ITYP
      0.000000000000      0.000000000000      8.979467422108    1    0    1
      0.000000000000      3.174721152808      4.489733711054    1    0    1
      0.000000000000     -3.174721152808      0.000000000000    1    0    1
      0.000000000000      0.000000000000     -4.489733711054    1    0    1
      0.000000000000      3.174721152808     -8.979467422108    1    0    1
      0.000000026956     -3.174721183174    -10.610158124432    1    1    2
 79.00 0.50  12.0107     1     1       0.0  : IATOMN ALFA AMION ILOC IVAN ZETA1
  1.00 0.50  12.0107     1     1       0.0  : IATOMN ALFA AMION ILOC IVAN ZETA1
 22    0     0     0     0                  : ICOND INIPOS INIVEL ININOS INIACC
 0     1                                    : IPRE IPRI
 200   200   0     80000.00    0            : NMD1 NMD2 LAST_ITER CPUMAX IFSTOP
 6     1                                    : WAY_MIX MIX_WHAT
 0     20    0.60                           : ITER_START KBXMIX  MIX_ALPHA
 0.20  0.30  0.20  0.20  0.20               : DTIM1 DTIM2 DTIM3 DTIM4 DTIM
 200.00      2     1     1.0D-12            : DTIO IMDALG IEXPL EDELTA
-0.0010      1.00D-03    0                  : WIDTH FORCCR ISTRESS
rev-vdW-DF2  1                              : XCTYPE KSPIN
 2.00                                       : DESTM
   101                                      : NBZTYP
     4    4    4                            : DUMMY
     4    4    4                            : DUMMY
    48                                      : KEG
     1                                      : NEXTST
     0                                      : DUMMY
     2                                      : IMSD
     0                                      : EVALUATE_EKO_DIFF
     0                                      : NPDOSAO
     0   0.000                              : SM_N DOPING
!
&KPOINTS_BAND
 NKSEG 3
 KMESH 40 20 40
 KPOINTS
 0.0        0.0        0.0
 0.5        0.0        0.0
 0.33333333 0.33333333 0.0
 0.0        0.0        0.0
&END
For the band structure calculation, ICOND is set to 22, and the following options are added in the input file&KPOINTS_BAND NKSEG 3 KMESH 40 20 40 KPOINTS 0.0 0.0 0.0 0.5 0.0 0.0 0.33333333 0.33333333 0.0 0.0 0.0 0.0 &END
where the variables in the &KPOINTS_BAND ... &END block are - the number of k-point segment (NKSEG)
- the k-point mesh for each segment (KMESH)
- the k-points which define the symmetry k-points (# of k-points should be NKSEG+1)
K-points are given in the unit of the reciprocal lattice vectors.
After the band structure run, the file "energy.data" is generated. To convert the "energy.data" into plottable one, "energy2band" utility is used. Type> energy2band
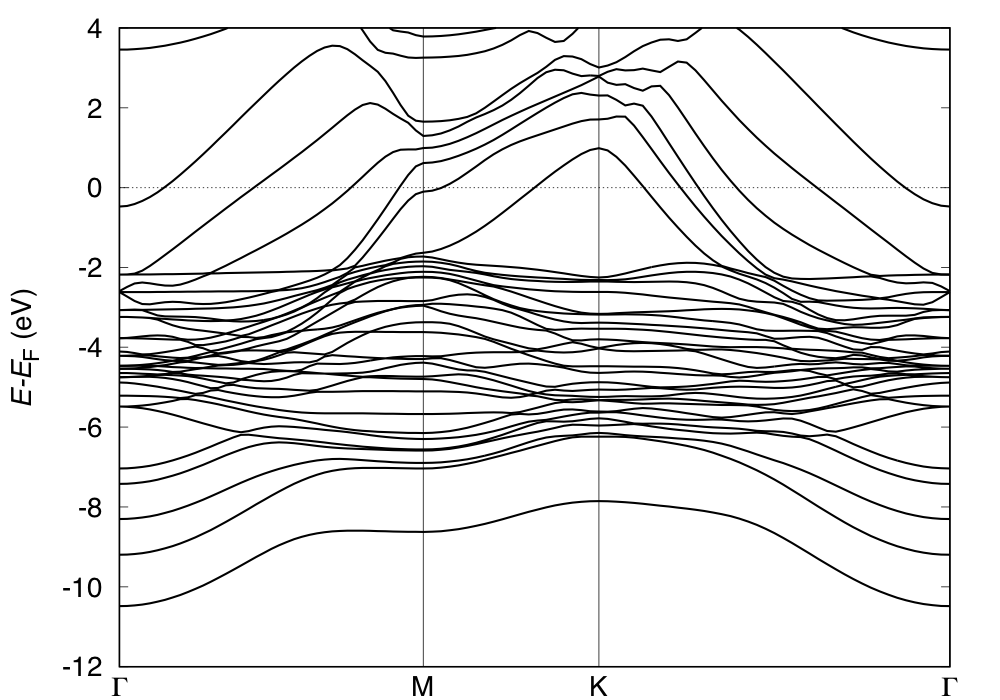
and input number of bands, number of bands to be plotted, number of k-points, and Fermi level, one gets "band.data", which can be plotted using gnuplot or xmgrace. Here is an example script to run energy2band:#!/bin/sh E2B=energy2band scfout_file='nfout_scf' bandout_file='nfout_band' ef=`grep 'FERMI' ${scfout_file} | awk '{print $4}'` nb=`grep 'NUMBER OF BANDS CONSIDERED' ${bandout_file} | awk '{print $6}'` nk=`grep 'NUMBER OF K-POINTS' ${bandout_file} | grep -v '=' | awk '{print $5}'` ${E2B} << EOF ${nb} ${nb} ${nk} ${ef} EOFBy using the following gnuplot script, the band structure can be visualized as follows:
The following gnuplot script can be used to generate the band structure plot:
emin=-12
emax=4
xmin=0.0000
xmax=1.80236106
G=0.00000000
M=0.65970994
K=1.04059365
G2=1.80236106
offset=-0.5
set xrange [xmin:xmax]
set yrange [emin:emax]
set arrow from M,emin to M,emax nohead lt 1
set arrow from K,emin to K,emax nohead lt 1
set xzeroaxis
unset xtics
unset key
set ylabel '{/Helvetica-Oblique E-E}_F (eV)'
set label '{/Symbol G}' at G,emin+offset center
set label 'M' at M,emin+offset center
set label 'K' at K,emin+offset center
set label '{/Symbol G}' at G2,emin+offset center
#set terminal postscript eps 'Helvetica' 20
#set output 'band.eps'
plot 'band.data' with lines lw 3
pause -1
![[PukiWiki] [PukiWiki]](image/logo_state-senri3_80x80.png)